Determining AHSS ductility with new bending test for cut edges
The limitations of the ISO 16630 hole expansion test for describing stretch-flangeability of advanced high-strength steels are well known. This article, based on the on-demand webinar, presents a new test method for cut edge ductility for predicting necking strain in edge forming. Attempts to use these results for forming simulations are also discussed, as well as the usefulness of this approach for evaluating overall edge-forming limits.
The limitations of ISO 16630 hole expansion and double-bending tests
There are many tests for cut edge ductility. This article first discusses two typical tests, the ISO 16630 hole expansion test and the double-bending test, and then explores a new, third test.
The 16630 hole expansion test (i.e., expanding a punched hole) delivers a geometric result: the percentage the hole can be expanded before a through-thickness crack occurs. That is, the test ends when the steel edge has already failed. And, in addition to the through crack, the punched edge could be covered with microcracks, as you can see in Figure 1.
With the double-bending test (i.e., bending the cut edge of the second bend until it cracks), we can measure the strain on the cut edge with a digital image correlation (DIC) technique: see Figure 2.
We can then use the strain results in our forming simulations. By comparison, the hole expansion test provides no strain results.
The hole expansion test is very simple. By comparison, it is more time-consuming to do the double-bending test. You must first consider the radius of the first bend and its flange height. Depending on the size of the flange height and thickness of the sample, you must control for buckling along the flange.

Figure 1: Close-up of an AHSS 16630 hole expansion test at point of cut edge failure, i.e., the end of test.

Figure 2: Double-bending test uses digital image correlation (DIC) to measure the strain on the cut edge of a sample of advanced high-strength steel.
We can then use the strain results in our forming simulations. By comparison, the hole expansion test provides no strain results.
The hole expansion test is very simple. By comparison, it is more time-consuming to do the double-bending test. You must first consider the radius of the first bend and its flange height. Depending on the size of the flange height and thickness of the sample, you must control for buckling along the flange.
Improving the double-bending ductility test by dropping a bend
To improve the double-bending test, we just removed the first bend. This saves a little time (one less bending operation) and we no longer need to consider the inner radius of the first bend. Instead, we place the cut sample on its edge in the press or press brake. And although it’s easier to stabilize this “flange,” we still use a special tool to prevent buckling: see Figure 3.
The parameters for this new test include:
- The knife radius: we started at 3 mm and went up to 10 mm in bending radius.
- The cutting parameters: we did a straight cut with a shearing tool, but you could vary the cutting angle and clearance.
- The sample height: very important, since you will get different strain distribution in the material depending on its height.
- The rolling direction: along (L) or transverse (T).
- And, of course, the steel grade being tested.
We first tested the following hot-rolled steel grades since they are typically used in chassis applications, which are very demanding on cut edges.
| Steel grade | Thickness |
| HR700MCA | 3.8 mm |
| HR800HER75 | 3 mm |
| HR800HER100 | 3 mm |
| HR1000CP | 2.9 mm |
We applied a random visual pattern onto the steel surface so we could monitor the complete forming sequence. We can monitor the horizontal strain, the vertical strain, the fracture point strain, and the bending angle, as shown in Figure 4.


Figure 3: An improved bending test: an AHSS sample is placed on its edge and then bent.

Figure 4: The new AHSS cut edge bending test allows for the monitoring of horizontal strain, vertical strain, fracture point strain, and the bending angle.
In Figure 5, the black curve is the strain along the cut edge, and the yellow curve is the vertical strain section.

Figure 5: Mapping the strain along the AHSS cut edge (black curve) and the vertical section (yellow curve).
Can we use these kinds of DIC measurements to monitor not just the maximum strain but also the necking strain? You’re probably familiar with Figure 6’s horizontal strain curve – the grey curve – which reminds us a little of the ISO FLD test section.

We can make a Gaussian curve fit, then remove everything inside of the curve’s inflection points, then make a new curve fit as shown by the yellow curve. We can then calculate the delta value – the distance between the inflection points – and the curve fit max strain (red circle), which we’ll later refer to as the CF max value. From our original data, we already have the max strain of the material.
For the vertical strain section, we collect one linear coefficient (b0) and one exponential coefficient (b1) as they can partially describe strain concentration in this direction of the material, as shown in Figure 7.

Figure 7: Partially describing the vertical strain concentration in the direction of the AHSS sample.
Comparing calculated bending depth to actual bending depth of AHSS steels
To verify that we are calculating something usable for predicting necking, we need to know how the material looks at the bending depth; see Figure 8.
Our steps are:
- Find the angle where CF-max occurs.
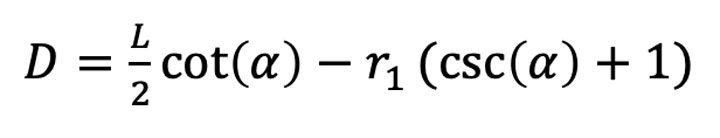
- Calculate the bending depth using this formula:
- Test the bending to depth, watching for necking
- Determine: is the cut edge quality approved at this depth?
Figure 9 shows the results from testing HR800HER75 steel (typical hole expansion ratio of 75%), which we’ve calculated to have a bending depth of 14 to 18mm, with 18mm being its max approved bending depth.
Figure 10 shows same investigation for HR700MCA steel, which we calculated to have a max approved bending depth of 10mm.

Figure 8: The radius (r1) used to determine the bending depth.

Figure 9: Testing the bending test to compare calculated max depth to actual max depth based on visible necking. At a bending depth of 18mm, we start to see some minor necking, which becomes more pronounced at 20mm, and is extremely obvious at 22mm.

Figure 10: Bending HR700MCA steel — with calculated a max approved depth of 10mm — shows necking initially at 11mm and more obviously at 12mm.
Our conclusion from the above investigation is that it appears that we can predict the maximum bending depth of a material, and that beyond the maximum depth, the cut edge deteriorates rapidly. And our calculations also deliver the defined bending angle for when necking will occur.
How the steel sample is cut matters for the ductility bending test
It matters whether the sample piece is supported or not during cutting; see Figure 11.
As you can see Figure 12, the mother piece can be bent much more than the daughter piece.
And the mother also has a better-looking cut edge, as shown in Figure 13.

Figure 11: We called the supported piece the “mother” and the unsupported, cut-off piece the “daughter”.

Figure 13: The mother piece has better cut edges than the daughter piece.
Most industrial applications likely work from the mother piece; so, this consideration is more applicable for test laboratories.
Figure 14 shows results from varying height of the sample, using 15, 20, and 25mm heights for the HR800HER75 steel. When we increase the height, we lower the curve fit max value (CF max), meaning the maximum necking strain will go down. The taller the sample height, the smaller the bending angle we can apply, resulting in less complicated bending for bigger flanges. The taller samples bring the exponent closer to zero, which means more linear strain concentration.

Figure 12: The daughter piece has a lower bending limit than the mother piece.

Figure 14: Results from 15, 20, and 25mm tall samples. The taller the sample, the more the linear strain concentration. Diameter: Individual standard deviations are used to calculate the intervals.
If, on the same material (HR800HER75), we increase the knife radius, we increase the width of the necking zone, or the delta value. We also get less vertical strain curve (the lower exponent). And we reduce the CF angle. So, as we increase the knife radius, we can make bigger bends – or more complicated bends – in the AHSS steel, as shown in Figure 15.

Figure 15: Results from increasing the knife radius to 3.5, 5, 8 and 10mm. As we increase the knife radius, we can increase our AHSS bending. Radius: Individual standard deviations are used to calculate the intervals.
We tested different cutting settings, indicated by 1, 2, 4 and 5 in Figure 16.

Figure 16: Testing different clearances and angles for the cutting set-up.
| Setting | 1 | 2 | 4 | 5 |
| Clearance | 10% | 15% | 10% | 15% |
| Angle | 1.25 | 1.25 | 2.25 | 2.25 |
The results of four different cutting settings, each tested in both the longitudinal and traverse directions, as shown in Figure 17.

Figure 17: Results from four different cutting settings. L = longitudinal direction and T = traverse direction. So 1L = means a 10% cutting clearance at a 1.25° angle in the longitudinal direction, and so on. Cut: Individual standard deviations are used to calculate the intervals.
None of the cutting variations appear to be statistically significant. However, overall, cutting setting 1 seems slightly better, meaning the bending angle is a bit lower, which is good: the material can bend a bit more.
We also tested pre-straining the materials to 2% and 4% plastic deformation. To get a more detailed explanation of the tests, please watch the on-demand webinar. Our conclusions were that pre-straining decreases formability, lowering the CF max and increasing the CF angle.
Next, we wanted to use our new bending test to determine the cut edge ductility of different steel grades. Samples were 20mm tall, the knife radius was 10mm (except for the 800 steel, which used a 5mm punch), cutting clearance was 10% at a low cutting angle, and the cut was longitudinal to the rolling direction.
For possible use in forming simulations, we focus on the CF-Max value, as shown in Figure 18.
But if our focus is on making big parts or complex shapes, we’ll look at the CF-Angle, the necking angle, as shown in Figure 19.
If you have a low CF-Angle, then it means that you can make a big complicated bend of that material. So here it's clear that the HR800HER100 material is better than the HR800HER75 material.

Figure 18: Determining the cut edge ductility of four AHSS grades – using the new bending test – for possible use in forming simulations.

Figure 19: Determining the necking angle of four AHSS steels.
Using the results from the new bending test for AHSS forming simulations
How would we implement these kinds of tests into a forming simulation? For example, to determine if we’ll have a split edge or not in the stamped part? The CF-Max values will depend on the strain concentration parameters Delta and exponent b1. And Delta and b1 can be varied by knife radius and sample height: so, we can test a lot of different scenarios. We set up our normal stamping simulation, checking the part in the critical area highlighted in Figure 20.
In these critical areas you can extract the same type of sections that you do in the bending test. In Figures 21 and 22 we can see that you will have a similar kind of appearance along the cut edge and in a vertical strain as well.

Figure 20: Using the new ductility bending test to check critical areas on formed AHSS automotive parts.

Figure 21: Checking the horizontal and vertical sections of a proposed auto part.


Figure 22: Calculating the delta – the distance between inflection points.
From the extracted sections we can calculate the concentration factors that we have learned from our cut edge bending tests. One was the delta value – the distance between the inflection points where the slope changes sign. The other is the exponent, where we fit this exponential function into the actual section of the part. And then in the part itself, we determine a maximum strain of 52%.
To compare our simulation results to our test values, we must ask: have we already tested these kinds of strain concentrations, delta and exponent b1? Or do we need to increase our test matrix to get them tested?
For this part in this simulation, we have a Delta of 12, an exponent of -0.09, and a max strain of 52%. From our tests, we have a delta value almost reaching 12 for the 25mm tall sample and our lowest possible exponent is minus 0.2 – it’s not all the way down to 0.1, which is what we are looking for.

Figure 23: Looking for the necessary exponent and delta. Diameter: Individual standard deviations are used to calculate the intervals.
But you can see the trend: in general, when we reduce the exponents, the CF max value will also be reduced. The CF max value from the test is approximately between 42% and 52%, and we have the part strain – which is 52% in this case. This indicates that the material is at a high risk of necking if we accept this kind of forming sequence.
This is how we think this new bending test could be implemented into actual AHSS parts – with a little bit higher safety margin compared to using maximum strains – by calculating for necking strain rather than failure strain.
Summary: a useful new cut edge bending test that needs to industrial validation
- This new Cut Edge Bending Test is simpler than the double-bending test and very quick to set up.
- Analysis of results can almost be fully automated.
- You can test different strain gradients along and normal to the cut edge, and they are simple to vary: e.g., the height of the sample, the knife radius, etc.
- You get both geometrical (CF-Angle or necking angle) and necking strain (CF-Max) results, so you can compare strain for simulation limits and compare materials to each other with geometrical results.
- You can test shear edges, applying different cutting angles and clearances.
- Applying pre-straining is very simple compared to the hole expansion test, where it’s very difficult to do.
- We would like to suggest this test has a practical implementation for forming simulations; but this is to be validated in industrial test cases.
- One drawback: this test delivers no strain gradients through the thickness direction – another parameter that potentially adds complexity to the challenging world of cut edge strains.
Do you have a project that requires testing for cut edge ductility – and you would like us to review how you are determining ductility? Contact us.
Related content

Determining AHSS cut edge ductility with a new edge bending test
The limitations of the ISO 16630 hole-expansion test for describing stretch-flangeability of advanced high-strength steels are well known. This webinar presents a new cut edge ductility test method that can be used for predicting necking strain in edge forming.
Go to webinar
AHSS automotive steel resources
From your design concept to prototyping and then mass production, fully leverage our resources and expertise to assure an efficient development of your AHSS/UHSS automotive components.
Read more
SSAB Docol® webinars
Stay ahead by watching our free webinars on advanced high strength steel in the automotive industry.
Read more