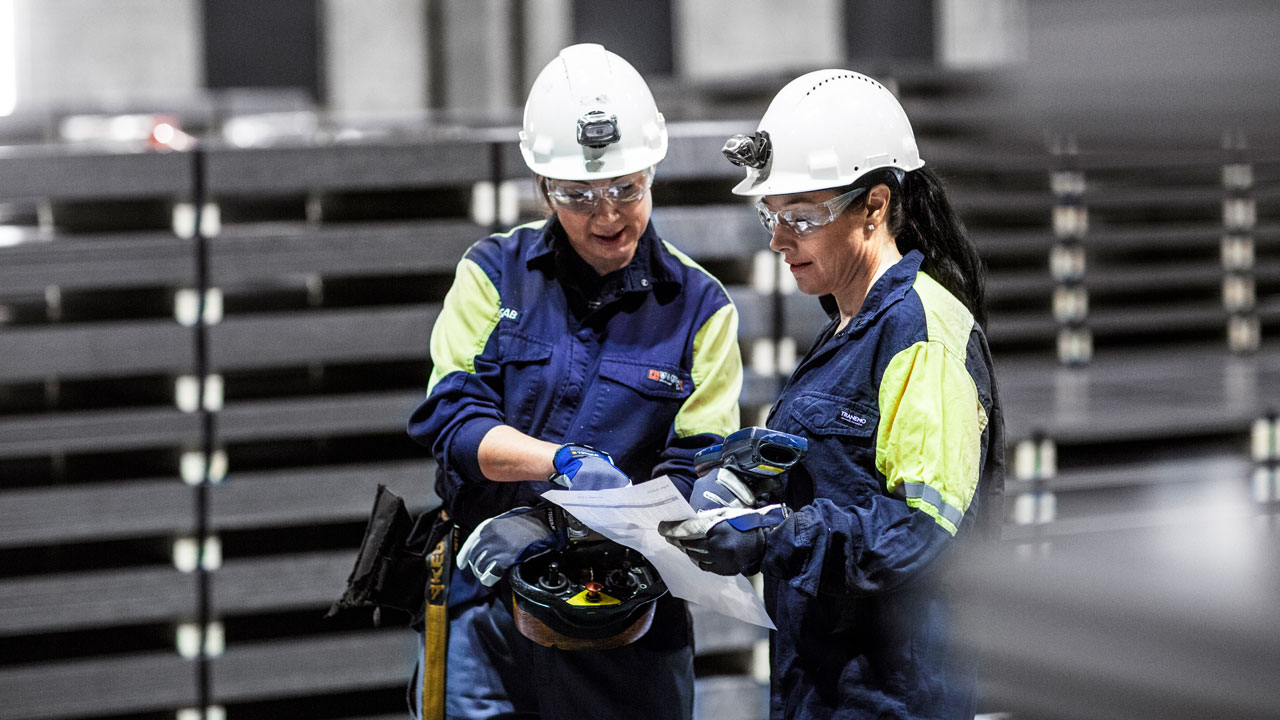
5-year summary
| |
2012 |
2011 |
2010, 3) |
2009 |
2008, 4) |
| Sales (SEK millions) |
38,923 |
44,640 |
39,883 |
29,838 |
54,329 |
| Operating profit (SEK millions) |
-96 |
2,512 |
1,132 |
-1,592 |
9,516 |
| Profit after financial items (SEK millions) |
-693 |
1,998 |
730 |
-2,061 |
8,953 |
| Profit after tax for shareholders in the Company (SEK millions) 1) |
15 |
1,560 |
557 |
-1,002 |
6,935 |
| Investments in plants and operations (SEK millions) |
1,461 |
3,210 |
2,011 |
1,912 |
2,606 |
| Cash flow from current operations (SEK millions) |
3,925 |
2,200 |
-731 |
3,387 |
5,387 |
| Net debt (SEK millions) |
15,498 |
18,475 |
17,589 |
15,314 |
16,992 |
| Capital employed at year-end (SEK millions) |
48,414 |
51,558 |
49,969 |
50,015 |
55,511 |
| Total assets (SEK millions) |
58,619 |
63,439 |
61,054 |
60,419 |
69,255 |
| Return on capital employed before tax (%) |
0 |
5 |
2 |
neg |
17 |
| Return on equity after tax (%) |
0 |
5 |
2 |
neg |
22 |
| Equity ratio (%) |
49 |
49 |
49 |
51 |
51 |
| Net debt/equity ratio (%) |
54 |
60 |
59 |
49 |
48 |
| Dividend per share (SEK), 2010 - proposal 2) |
1.00 |
2.00 |
2.00 |
1.00 |
4.00 |
| Earnings per share (SEK) 2) |
0.05 |
4.82 |
1.72 |
-3.09 |
21.41
|
| Average number of employees 3) |
8,695 |
8,830 |
8,477 |
8,334 |
9,172 |
| Sales per average employee (SEK millions) |
4.5 |
5.1 |
4.7 |
3.6 |
5.9 |
| Production of crude steel (thousand tonnes) 4) |
5,253 |
5,671 |
5,752 |
3,553 |
6,074 |
1) Earnings from the discontinued tubular business in IPSCO impacted on the earnings for 2010 in the amount of SEK -164 million, 2009 in the amount of SEK -131 million and for 2008 in the amount of SEK 490 million.
2) 2007 includes "old SSAB" with 3,957 thousand tonnes and SSAB North America for the full year of 2007 with 2,583 thousand tonnes.
3) Adjustments have been done as a consequence of changed accounting principles. See Note 28 in the Annual report. The years, 2007-2009, have not been adjusted.
4) Excluding the divested tubular business.
Financial summeries and Production data
Financial data for SSAB by quarter.
Statistics for SSAB production and deliveries per quarter.
Statistics for SSAB production and deliveries yearly since 2004.